River image
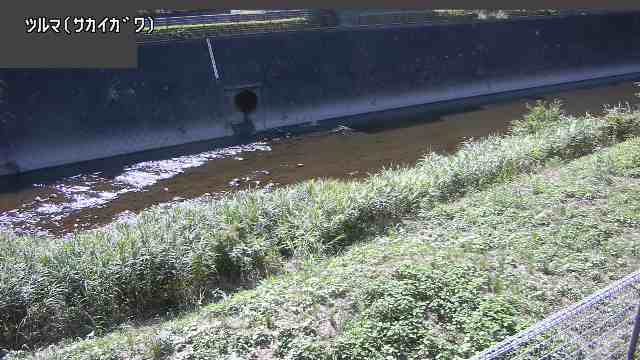
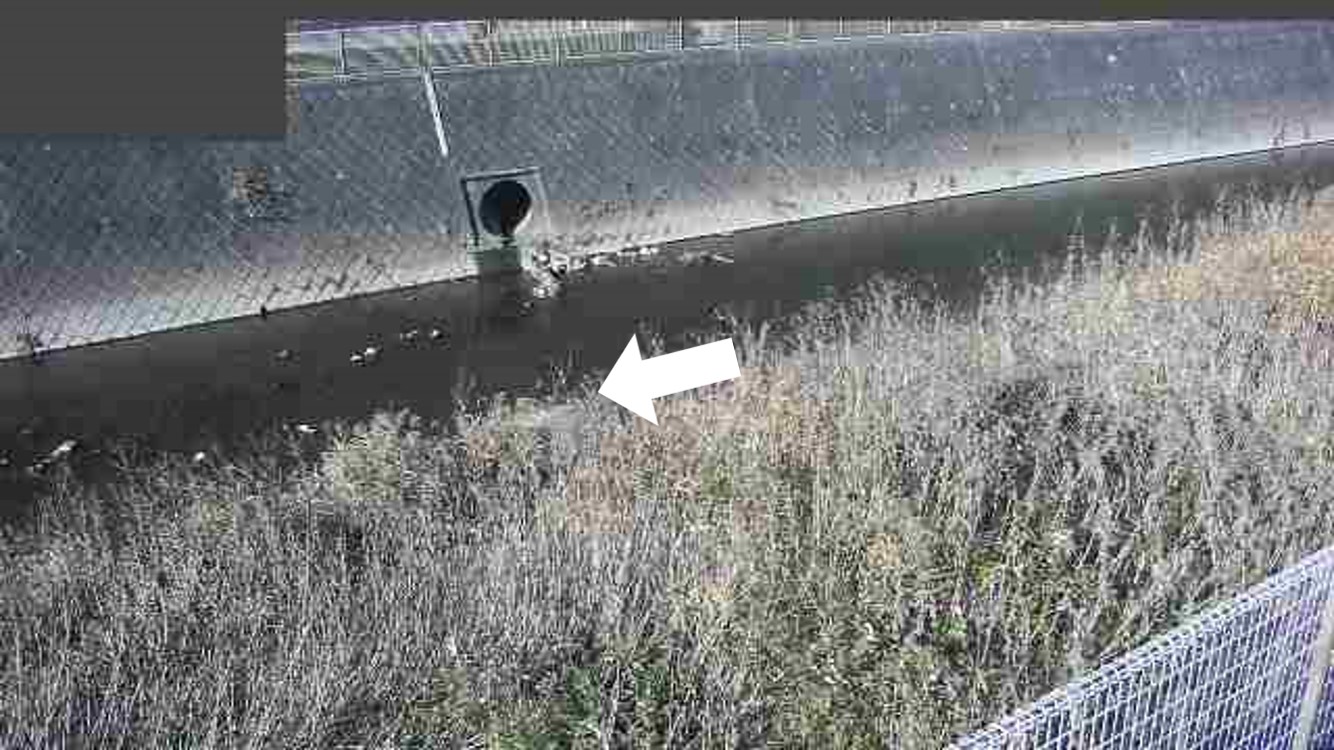
- Observation station
- Tsuruma
- River name
- Sakai river
- Taken date & time
- 2025/06/28 14:44
Ordinary times
This website provides rainfall amount and river water level information observed in Tokyo, as well as the warnings, alarms and special alarms in real time.
Negishi bridge


Sakai bridge
Legend
River image symbol
10-min rainfall
Storage ratio of regulating reservoir
Floodgate tide level (mountain side) ⁄ (ocean side)
Ordinary times

| Water level | |
|---|---|
| Flood inundation water level | |
| 80% water level | |
| 50% water level | |
| Water level | |
| No line | Stopped ⁄ missed |
| River cross-section view | |
|---|---|
| Flood inundation water level is exceeded | |
| 80% water level is exceeded | |
| 50% water level is exceeded | |
| Normal period | |
| Stopped ⁄ missed | |
| Observation data | |
|---|---|
| Missing | |
| Blank | Unmeasure |
| Observation data | |
|---|---|
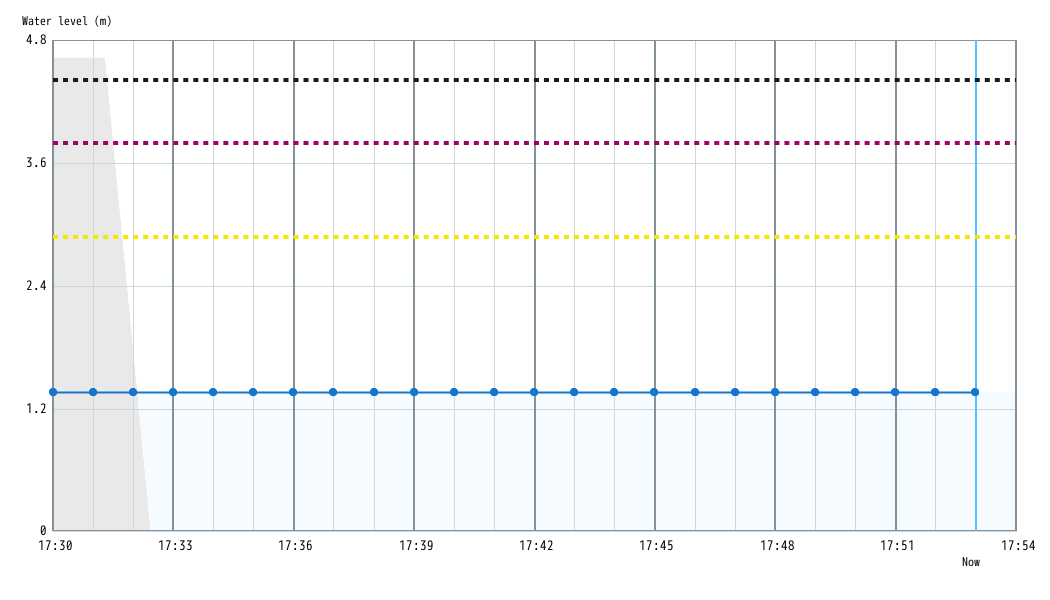
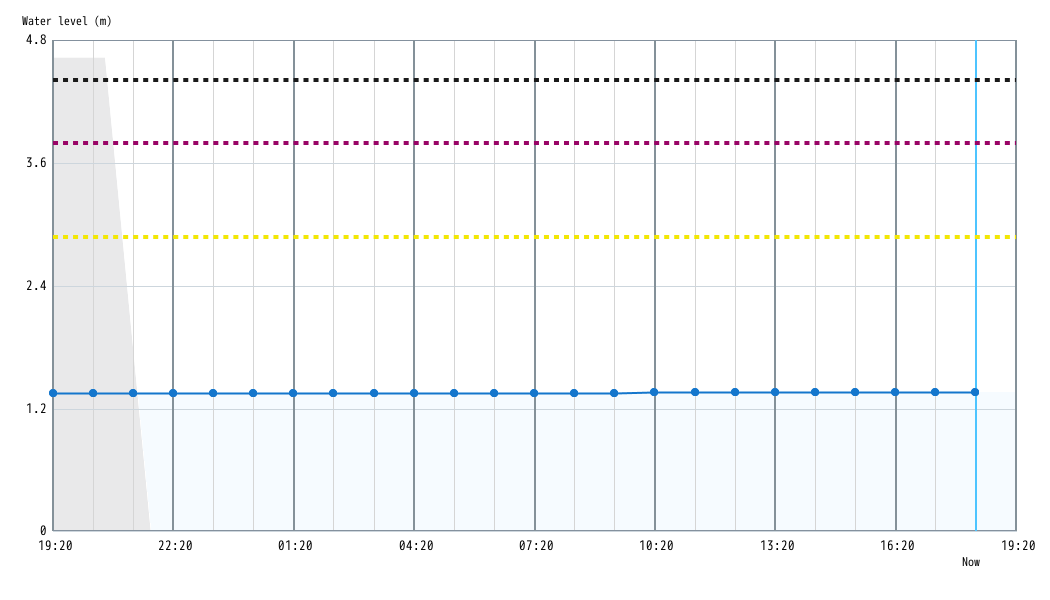
| Current water level(m) | 1.36 |
| A.P.(m) | 63.51 |
| Crest level descent(m) | 3.05 |
| Designated water level | Water level(m) | A.P.(m) | Crest level descent(m) |
|---|---|---|---|
| Flood inundation water level | 4.41 | 66.56 | 0.00 |
| 80% water level | 3.80 | 65.95 | 0.61 |
| 50% water level | 2.88 | 65.03 | 1.53 |
| Observation date & time | 10:50 | 11:00 | 11:10 | 11:20 | 11:30 | 11:40 | 11:50 | 12:00 | 12:10 | 12:20 | 12:30 | 12:40 | 12:50 | 13:00 | 13:10 | 13:20 | 13:30 | 13:40 | 13:50 | 14:00 | 14:10 | 14:20 | 14:30 | 14:40 |
|---|---|---|---|---|---|---|---|---|---|---|---|---|---|---|---|---|---|---|---|---|---|---|---|---|
| Water level | 1.36 | 1.36 | 1.36 | 1.36 | 1.36 | 1.36 | 1.36 | 1.36 | 1.36 | 1.36 | 1.36 | 1.36 | 1.36 | 1.36 | 1.36 | 1.36 | 1.36 | 1.36 | 1.36 | 1.36 | 1.36 | 1.36 | 1.36 | 1.36 |
* Depending on the installation condition of the water gauge,1.35m cannot be observed, therefore the measurement value will not change.
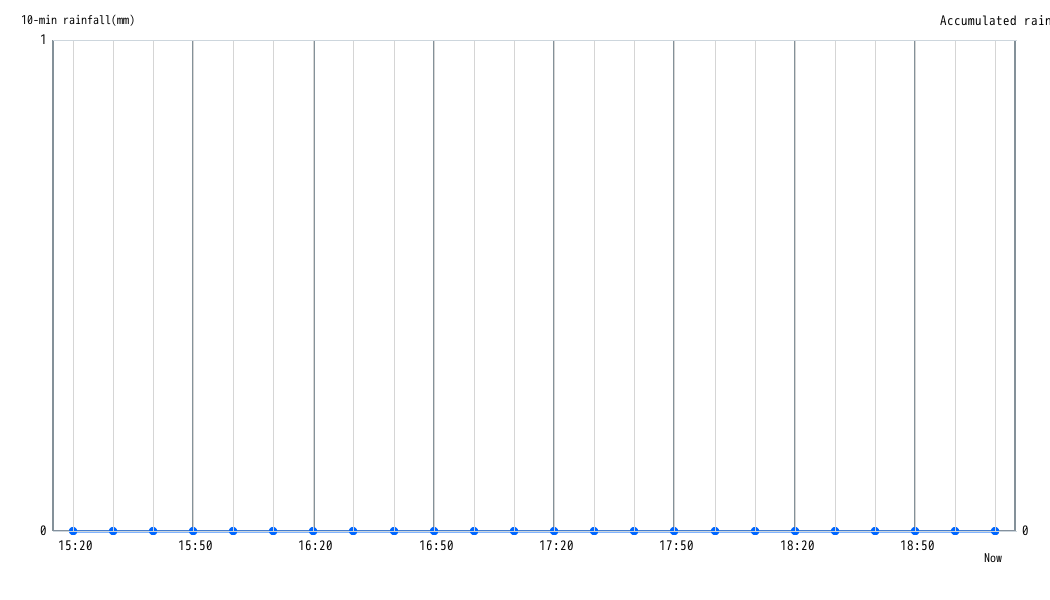
| Unit-time rainfall | |
| Accumulated rainfall | |
| None | Missing ⁄ Unmeasure |
| Observation data | |
|---|---|
| Missing | |
| Blank | Unmeasure |
| Red characters | Hourly maximum rainfall duration |
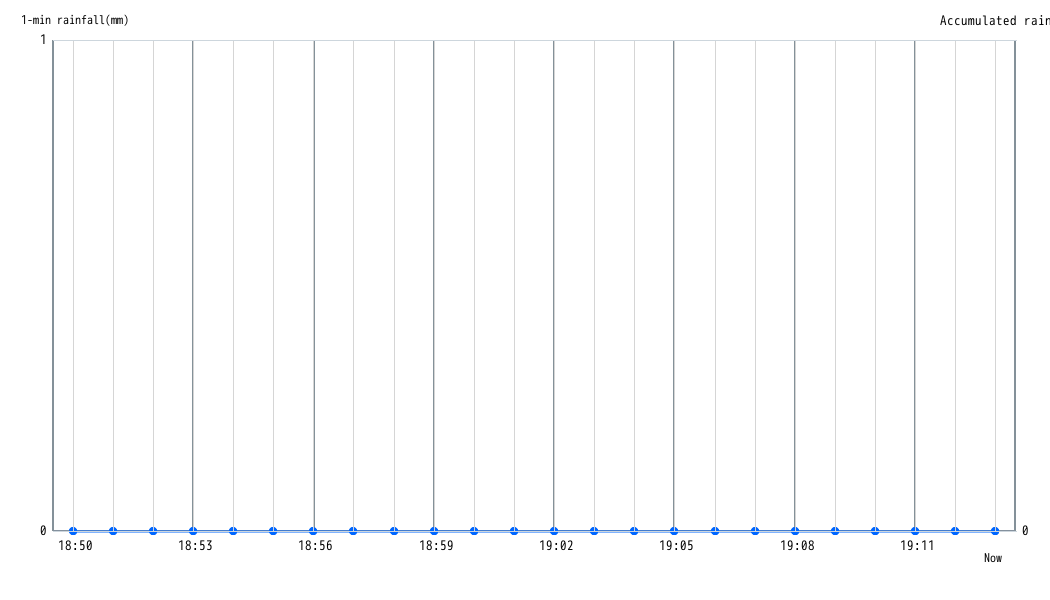
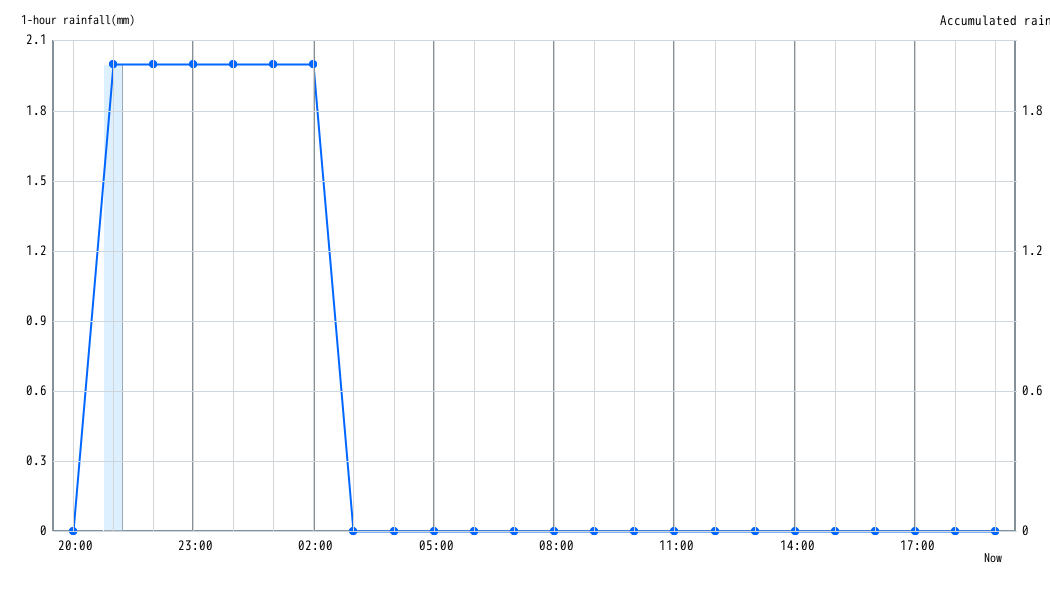
| Observation date & time | 10:50 | 11:00 | 11:10 | 11:20 | 11:30 | 11:40 | 11:50 | 12:00 | 12:10 | 12:20 | 12:30 | 12:40 | 12:50 | 13:00 | 13:10 | 13:20 | 13:30 | 13:40 | 13:50 | 14:00 | 14:10 | 14:20 | 14:30 | 14:40 |
|---|---|---|---|---|---|---|---|---|---|---|---|---|---|---|---|---|---|---|---|---|---|---|---|---|
| 10-min rainfall | 0 | 0 | 0 | 0 | 0 | 0 | 0 | 0 | 0 | 0 | 0 | 0 | 0 | 0 | 0 | 0 | 0 | 0 | 0 | 0 | 0 | 0 | 0 | 0 |
| Accumulated rainfall | 0 | 0 | 0 | 0 | 0 | 0 | 0 | 0 | 0 | 0 | 0 | 0 | 0 | 0 | 0 | 0 | 0 | 0 | 0 | 0 | 0 | 0 | 0 | 0 |
| Hourly maximum rainfall | 0 |
* The hourly maximum rainfall in the table shows the maximum rainfall during the graph display time. (if you select the 1-minute rainfall, the maximum hourly rainfall will not be shown)